 LINGCORE SCI
Quantitative Bias Analysis in Clinical Epidemiology: Turning Sensitivity Questions into Explicit Assumptions
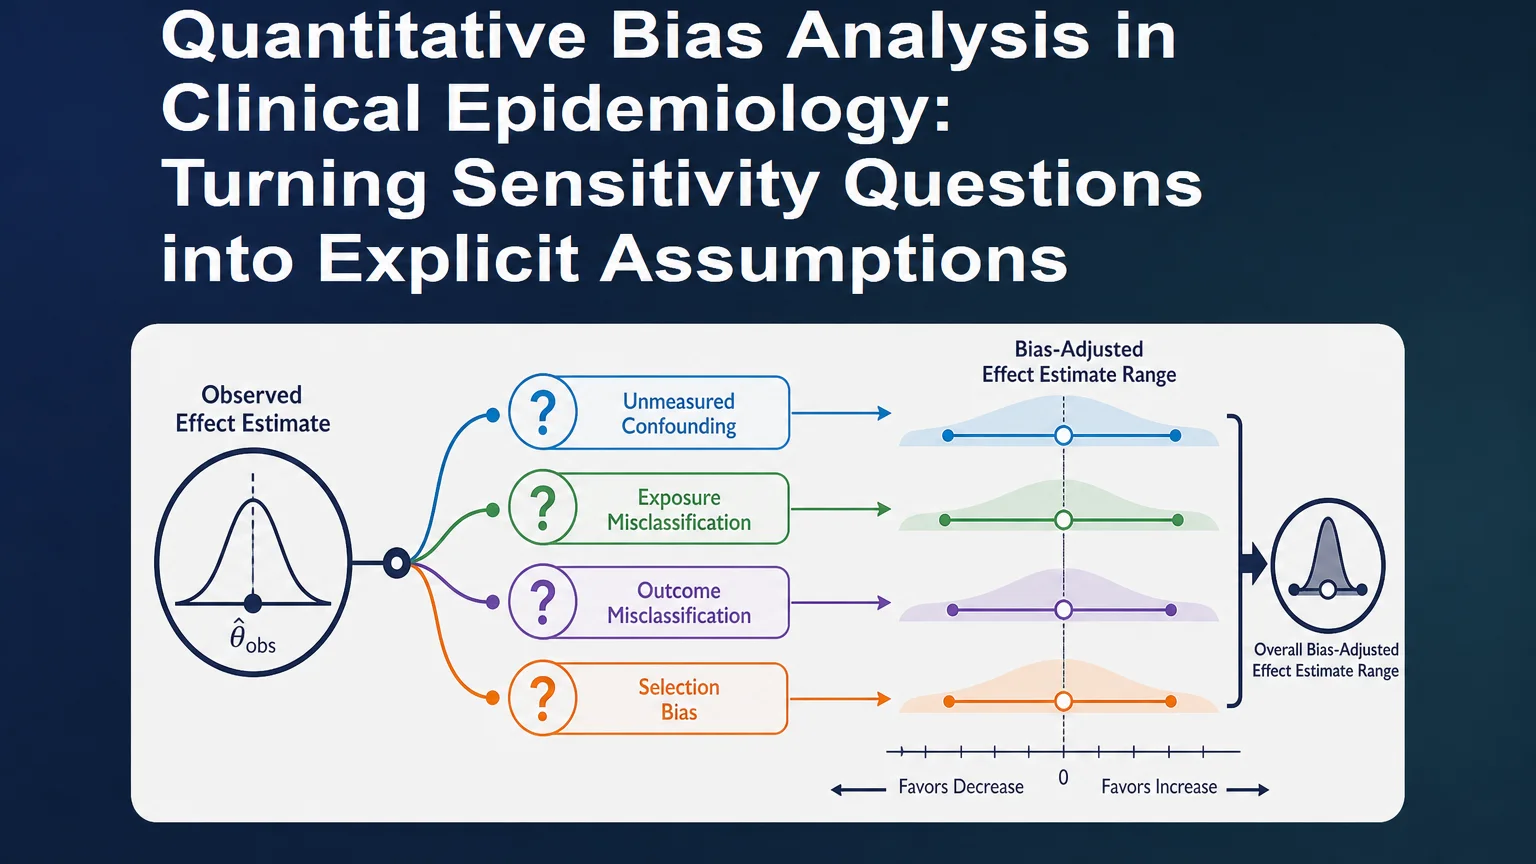
Quantitative bias analysis evaluates how specified amounts of systematic error could change an observed estimate. It replaces a vague statement that “residual confounding may remain” with explicit bias parameters, a reproducible range of corrected estimates, or a probability distribution. The result is a sensitivity analysis, not proof that bias is absent and not a substitute for sound study design.
Clinical epidemiology rarely observes every determinant of treatment, exposure, outcome measurement, follow-up, and study inclusion. Even after careful design and adjustment, systematic error can remain. A regression coefficient, hazard ratio, odds ratio, or risk difference may therefore reflect a mixture of the association of interest and bias introduced by unmeasured confounding, selection, or measurement error.
Quantitative bias analysis (QBA) makes that problem analyzable. The investigator specifies a bias mechanism, assigns plausible values to the relevant sensitivity parameters, and recalculates the estimate under those scenarios. A deterministic analysis reports selected scenarios or bounds. A probabilistic analysis assigns distributions to the bias parameters and propagates them through repeated simulations. Both approaches require assumptions that must be described, justified, and stress-tested.
The practical value of QBA is not a single “adjusted” number. It is a transparent map of how much systematic error would be required to move the result toward a clinically important threshold, reverse its direction, or remove the apparent association. That map should be interpreted alongside the primary design, measured covariate balance, missing-data strategy, and external evidence.
What QBA can and cannot answer
QBA can address questions such as: How strong would an unmeasured confounder need to be to explain the observed association? How would imperfect exposure classification affect the risk ratio? What range of estimates is compatible with plausible outcome misclassification? How sensitive is a result to selection into the analytic sample? These questions are distinct, and each requires a bias model that matches the data-generating concern.
QBA cannot demonstrate that a study is unbiased. It cannot recover information that was never measured without assumptions, and it cannot convert an observational association into a randomized effect. A narrow sensitivity range may simply reflect narrow parameter distributions, while a broad range may reflect honest uncertainty rather than analytical failure. The credibility of the analysis depends on the provenance of the sensitivity parameters and the plausibility of the bias mechanism.
Four bias mechanisms to distinguish
| Bias mechanism | Typical question | Parameter inputs | Reporting requirement |
|---|---|---|---|
| Unmeasured confounding | Could a factor related to both exposure and outcome explain the observed association? | Confounder prevalence or distribution by exposure and outcome associations, or a summary sensitivity parameter. | Explain the confounder scenario, the direction of bias, and why the chosen strengths are plausible. |
| Exposure misclassification | How would incorrect exposure assignment change the estimate? | Sensitivity and specificity of exposure classification, possibly stratified by outcome or covariates. | State the validation source, differential versus nondifferential assumption, and uncertainty in accuracy estimates. |
| Outcome misclassification | Could imperfect outcome ascertainment create or obscure the association? | Outcome sensitivity and specificity, with differential accuracy considered when clinically plausible. | Describe adjudication, coding validation, chart review, or other evidence supporting the parameters. |
| Selection bias | Could inclusion, retention, or conditioning on a selected sample distort the comparison? | Selection probabilities or selection-outcome and selection-exposure associations. | Define the selection process and show how the assumed selection pattern changes the estimate. |
These mechanisms can coexist. A study may have unmeasured confounding and exposure misclassification at the same time, but a joint analysis requires more parameters and stronger assumptions. Investigators should avoid adding bias mechanisms merely to make the analysis look comprehensive. The mechanism should follow the study design, measurement process, and clinical context.
E-values and fuller bias analyses
The E-value is a compact sensitivity measure for unmeasured confounding. For a risk ratio or a related effect measure, it characterizes the minimum strength of association that an unmeasured confounder would need with both the exposure and outcome, conditional on measured covariates, to move the estimate to a specified null or threshold value under the stated causal model. It is useful for communication because it compresses a sensitivity question into a single scale.
That compression is also its limitation. An E-value does not identify a real confounder, does not specify its prevalence, does not address all forms of selection or measurement error, and does not replace a bias model when investigators have substantive information about a likely unmeasured variable. The estimate, confidence interval, effect scale, and target threshold must be reported together. Applying an E-value to the point estimate while ignoring the confidence interval can overstate robustness.
A fuller QBA makes the bias parameters visible. For example, a probabilistic analysis can assign distributions to exposure sensitivity, exposure specificity, and differential outcome classification based on validation studies or expert-elicited ranges. Each simulation draws a parameter set, applies the corresponding bias correction, and stores the corrected estimate. The resulting distribution describes uncertainty induced by the assumed systematic error in addition to the sampling uncertainty represented by the original analysis.
The output should not be called a standard confidence interval unless its construction supports that terminology. Report the simulation design, number of draws, parameter distributions, correlations among parameters, truncation rules, and convergence or Monte Carlo error checks. A deterministic scenario table may be preferable when empirical information is limited and a probability distribution would imply unjustified precision.
QBA versus neighboring sensitivity strategies
| Strategy | Primary output | Best use | Common overinterpretation |
|---|---|---|---|
| Negative-control analysis | Association with a control exposure or outcome that should not share the causal pathway. | Detect or probe residual systematic error using an observed comparator. | A null negative control does not prove that all confounding is absent. |
| Quantitative bias analysis | Bias-adjusted estimates, ranges, bounds, or simulated distributions. | Translate plausible systematic-error parameters into effect-scale consequences. | The corrected estimate is treated as observed truth rather than assumption-dependent output. |
| E-value | Minimum confounding strength needed to reach a chosen threshold. | Communicate a compact robustness metric for selected effect measures. | A large E-value is interpreted as evidence that the estimate is causal. |
| Trimming or restriction | Estimate in a restricted analytic population. | Reduce extrapolation or address lack of overlap in measured covariates. | The restricted result is generalized to the original population without justification. |
| Tipping-point analysis | Threshold at which conclusions change under a grid of assumptions. | Show when a decision, direction, or clinical conclusion would change. | The chosen grid is presented as objective without explaining its range. |
QBA also complements the causal methods already used in clinical research. An overlap-weighting analysis can improve the target population and measured balance, while QBA can examine how a specified unmeasured confounder or classification error could affect the resulting estimate. Similarly, AIPW, TMLE, and the parametric G-formula address estimation under explicit causal models; none removes the need to examine systematic-error assumptions.
Five steps for a defensible QBA
| Step | Research action | Quality gate |
|---|---|---|
| 1. Name the estimand and bias concern | State the population, exposure or treatment, comparator, outcome, time horizon, effect measure, and suspected bias mechanism. | The sensitivity question is connected to the primary causal estimand. |
| 2. Draw the bias pathway | Use a causal diagram, measurement process map, or selection description to show where systematic error enters. | The model does not mix post-exposure variables with baseline confounders without explanation. |
| 3. Source sensitivity parameters | Use validation data, external studies, clinical knowledge, expert elicitation, or clearly labeled broad scenarios. | Every parameter has a rationale, range, and direction of influence. |
| 4. Run deterministic and/or probabilistic analyses | Recalculate the effect across scenarios or simulated parameter draws, preserving the original analysis definition. | Simulation settings, correlations, draws, and Monte Carlo uncertainty are reported. |
| 5. Interpret against a clinical threshold | Compare adjusted estimates with the null, a prespecified minimally important effect, or a decision threshold. | The conclusion states what assumptions would change the decision and avoids causal certainty. |
How to choose parameter ranges
Parameter selection is the scientific core of QBA. A range should not be chosen because it makes the result robust or fragile. It should be anchored to observed validation studies, comparable populations, chart-review samples, repeated measurements, registry linkage quality, or clinical expertise. If the evidence is weak, present several transparent scenarios rather than hiding the uncertainty inside a narrow distribution.
For misclassification, distinguish nondifferential from differential error. Nondifferential classification is often assumed for convenience, but the assumption may be implausible when diagnostic intensity differs by treatment, disease severity, or access to care. For unmeasured confounding, distinguish a summary E-value calculation from a parameterized confounder analysis. For selection bias, define whether selection depends on exposure, outcome, both, or a collider created by study inclusion.
Correlations among bias parameters matter. Sensitivity and specificity estimates obtained from the same validation study may not be independent, and confounder associations may share a clinical mechanism. A probabilistic analysis that samples every parameter independently can understate or misrepresent uncertainty. When dependence cannot be estimated, conduct alternative correlation scenarios and state the limitation.
Evidence Summary Table
| Source | Contribution | Evidence level and boundary |
|---|---|---|
| VanderWeele and Ding, Annals of Internal Medicine, 2017 PubMed record | Introduces the E-value as a sensitivity-analysis measure for unmeasured confounding in observational research. | Methods framework; interpretation depends on the effect measure and causal assumptions. |
| Quantitative bias analysis in epidemiological research, systematic review Reported review record | Reviews the use of QBA in epidemiological research and illustrates the range of systematic-error applications. | Secondary evidence; the underlying studies and parameter choices must be inspected. |
| Early initiation of prophylactic anticoagulation, 2021 PubMed record | Clinical application reporting a quantitative bias analysis for unmeasured confounding in an observational treatment question. | Applied observational evidence; the reported E-value does not eliminate residual bias. |
| Probabilistic bias analysis of unmeasured confounding, 2019 PubMed record | Illustrates probabilistic quantitative bias analysis for a potential unmeasured confounder in a clinical epidemiology setting. | Applied methods evidence; transferability of parameter distributions is context-specific. |
| Selection bias analysis among live births, 2018 PubMed record | Demonstrates that selection bias can require a dedicated quantitative analysis rather than a generic confounding statement. | Bias-specific application; the selection process and target population must be defined. |
What a transparent manuscript should report
Readers should be able to identify the primary estimate before reading the sensitivity analysis. Report the design, population, exposure or treatment, outcome, covariate adjustment, missing-data approach, and original uncertainty estimate. Then state why QBA was added, which bias mechanism it addresses, and whether the analysis is deterministic, probabilistic, or both.
For each parameter, report its definition, source, plausible range or probability distribution, dependence assumptions, and direction of bias. Present the corrected estimates or distribution in a table or figure that can be read without reverse-engineering code. If the analysis uses an E-value, give the effect measure, point estimate, confidence interval, and threshold. Explain which assumptions would be required to change the scientific conclusion.
The discussion should separate three claims: what the observed data show, what the primary analysis estimates under its causal assumptions, and what the sensitivity analysis implies under additional bias assumptions. This separation prevents a QBA from becoming either a ritual paragraph about residual confounding or an overconfident claim that a result is “robust.”
Researcher's Toolkit
Use Lingcore SCI to structure and audit a quantitative bias analysis:
- Paper Analyzer: extract the estimand, bias mechanism, parameter definitions, and interpretation limits from an epidemiologic study.
- Review Builder: synthesize E-values, probabilistic bias analyses, selection analyses, and measurement-error methods with source-linked evidence.
- Journal Matcher: identify journals aligned with clinical epidemiology, causal inference, pharmacoepidemiology, and real-world evidence.