 LINGCORE SCI
AIPW and Doubly Robust Estimation in Clinical Research: Combining Treatment and Outcome Models

Augmented inverse probability weighting (AIPW) estimates a causal treatment effect by combining a treatment-assignment model with an outcome model. Under the usual causal assumptions, the estimator is called doubly robust because consistency can be retained when either one of these two models is correctly specified, although not both models may be wrong, and positivity, exchangeability, consistency, and uncertainty estimation still require direct assessment.
Clinical researchers often face the same practical problem: treatment groups differ before treatment begins, yet the study question asks what would have happened under alternative treatment strategies. Randomization can balance measured and unmeasured factors in a trial, but observational cohorts require a defensible adjustment strategy. AIPW is one such strategy. It does not remove confounding by naming a method; it creates an estimator that uses two complementary descriptions of the observed data and makes the assumptions visible.
The method is particularly useful when investigators want an average treatment effect, an average treatment effect among the treated, or a related population-level causal contrast from baseline observational data. It is also a useful bridge between inverse probability weighting, outcome regression, semiparametric efficiency, and modern machine-learning-assisted causal analysis. The central discipline remains the same: define the estimand before choosing the estimator.
What AIPW adds to ordinary weighting
Inverse probability weighting uses an estimated propensity score, the probability of receiving the observed treatment conditional on measured baseline covariates. For a binary treatment, individuals who received treatment that was relatively unlikely given their covariates receive more weight, while individuals whose observed treatment was highly expected receive less extreme weight. In an ideal weighted pseudo-population, measured baseline differences between treatment groups are reduced.
Outcome regression takes a different route. It models the expected outcome conditional on treatment and covariates, then uses the fitted model to predict counterfactual outcomes under each treatment level. If the outcome model is well specified, standardization or regression adjustment can estimate a population-level contrast without constructing inverse weights.
AIPW combines both ideas. One component uses outcome predictions, and a correction term uses the treatment model to reweight residuals: the difference between the observed outcome and the prediction for the treatment actually received. When the outcome model is adequate, the residual correction is centered appropriately. When the treatment model is adequate, the weighting correction can recover the target contrast even if the outcome regression is imperfect. This complementary structure is the source of the double-robust property.
The estimand comes before the estimator
AIPW is not itself an estimand. Investigators should state the causal question in terms of potential outcomes and a target population before fitting either nuisance model. A common estimand is the average treatment effect, defined conceptually as the average difference between the outcome that would be observed if the population received treatment and the outcome that would be observed if the same population received control.
Other questions require different targets. The average treatment effect among the treated asks about the effect in those who actually received treatment. A policy estimand may compare two treatment rules rather than two static treatment levels. A per-protocol effect may require longitudinal treatment and censoring models, in which case a single baseline AIPW analysis is not sufficient. The outcome scale also matters: risk difference, risk ratio, odds ratio, mean difference, restricted mean survival time, and survival probability are not interchangeable.
For a clinical manuscript, define the intervention, comparator, time zero, follow-up window, outcome, population, and effect measure. Then state whether the analysis targets an explanatory causal effect, a treatment-policy effect, or a descriptive association. AIPW should answer the prespecified question rather than determine it after model fitting.
How the two nuisance models work together
The treatment model, often called the propensity score model for a binary exposure, estimates the conditional probability of treatment. Covariates should be selected because they are relevant to confounding control and the causal question, not simply because they predict the outcome or meet a p-value threshold. The treatment model may use logistic regression, flexible regression, or a supervised-learning algorithm, but predictive performance alone is not a sufficient causal criterion.
The outcome model estimates the expected outcome under each treatment level conditional on covariates. Its form depends on the outcome: a suitable mean model for a continuous outcome, a risk model for a binary outcome, a count model for event rates, or a survival-specific approach for time-to-event outcomes. A model that predicts well on average may still produce poor causal contrasts if it extrapolates in regions with weak treatment overlap.
The AIPW correction compares observed outcomes with treatment-specific predictions and scales the residual by the estimated probability of the treatment actually received. The final estimator combines the predicted counterfactual outcomes with these weighted residual corrections. In practice, the formula is less important than the audit trail: investigators must show how each model was specified, what covariates were used, how predictions were generated, and how uncertainty was calculated.
Double robustness is not a substitute for diagnostics
The phrase can create false reassurance when it is presented without the assumptions around it. First, exchangeability requires that measured covariates adequately control confounding for the target treatment contrast. AIPW cannot adjust for an important unmeasured factor merely because two models are included. Directed acyclic graphs, subject-matter knowledge, and prespecified covariate strategies remain important.
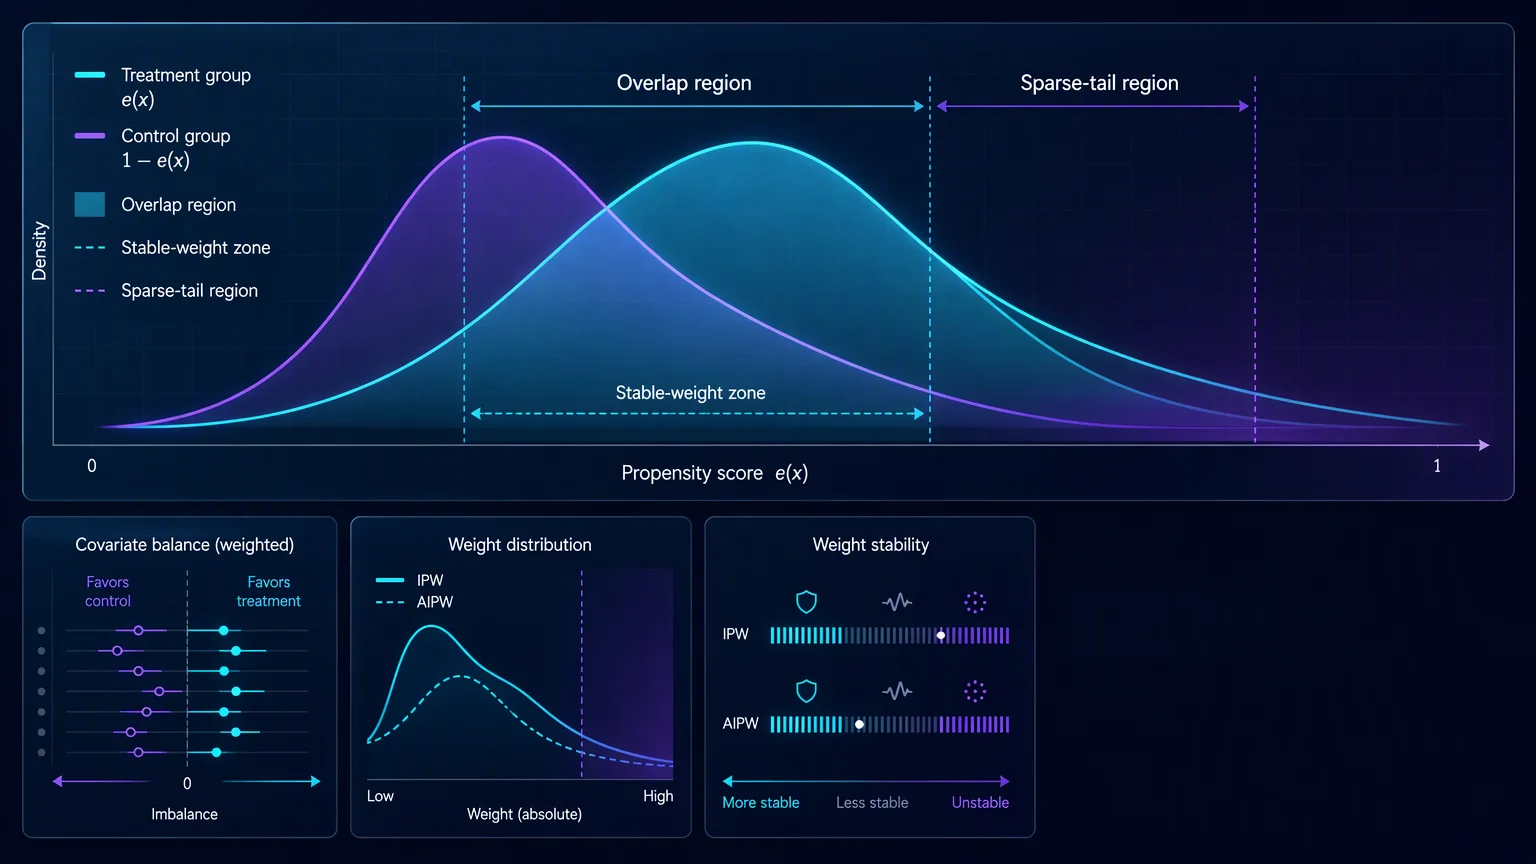
Second, positivity requires that each individual or covariate pattern in the target population has a non-zero, clinically plausible probability of receiving each treatment level being compared. Empirical near-violations appear as propensity scores close to zero or one, limited overlap between treatment groups, or highly variable inverse weights. Trimming, truncation, redefining the target population, or changing the estimand may be considered, but these choices must be prespecified or transparently reported because they change the question being answered.
Third, consistency requires that the treatment level is sufficiently well defined and that the observed outcome under the received treatment corresponds to the relevant potential outcome. “Usual care” may contain multiple treatment versions. If those versions have different effects, a single binary exposure may not identify a clear intervention.
Researchers should inspect treatment-model calibration, covariate balance after weighting, propensity-score overlap, the distribution of weights, outcome-model calibration, influential observations, and the sensitivity of the estimate to reasonable modeling choices. Balance is a diagnostic of the weighted design, not proof that all confounding has been removed.
| Component | What to examine | Interpretation boundary |
|---|---|---|
| Estimand | Intervention, comparator, time zero, outcome, follow-up, target population, and effect scale. | AIPW cannot repair an ambiguous or post-treatment-defined estimand. |
| Treatment model | Covariate specification, calibration, overlap, and treatment-probability range. | Good discrimination is not the same as valid confounding control. |
| Outcome model | Functional form, interactions, calibration, residual behavior, and treatment-specific predictions. | Predictive accuracy does not establish causal validity. |
| Weighting correction | Weight distribution, extreme values, truncation rules, and effective sample size. | Stabilization or truncation changes finite-sample behavior and may change the target population. |
| Inference | Influence-function-based standard errors, bootstrap strategy, confidence intervals, and clustering. | Naive standard errors can be inappropriate when nuisance estimation and weighting are ignored. |
AIPW compared with nearby approaches
Outcome regression is attractive when the outcome process can be modeled credibly, but it may be sensitive to functional-form errors. Pure inverse probability weighting focuses on treatment assignment and can be less dependent on the outcome model, but extreme weights may produce unstable estimates. Matching changes the analysis population and may target a different effect depending on the matching design. Targeted minimum loss-based estimation also uses outcome and treatment information and is designed around an updating step that targets a prespecified parameter; AIPW and TMLE are related but should not be treated as identical implementations.
For longitudinal exposures, inverse probability weighting can be embedded in marginal structural models, while sequential g-computation models the longitudinal data-generating process. Longitudinal AIPW or related estimating-equation approaches require treatment, censoring, and sometimes observation-process models at each relevant time point. A baseline AIPW analysis should not be presented as if it solves time-varying confounding. For a broader comparison, see the guides to the parametric G-formula and TMLE.
| Approach | Primary information used | Typical advantage | Important limitation |
|---|---|---|---|
| Outcome regression | Outcome model conditional on treatment and covariates. | Direct counterfactual prediction and familiar clinical interpretation. | Can be biased when the outcome model is misspecified or extrapolates. |
| IPW | Estimated treatment probabilities. | Creates a weighted pseudo-population and can avoid direct outcome modeling. | Can be unstable under limited overlap and extreme weights. |
| AIPW | Treatment model plus outcome model and residual correction. | Double-robust structure and potential efficiency gains when both models are useful. | Still depends on identification assumptions, overlap, correct implementation, and valid inference. |
| TMLE | Initial outcome model, treatment model, and targeted updating step. | Parameter-focused estimation with flexible nuisance learning. | More implementation choices and diagnostics are required; it is not a generic license for black-box analysis. |
Actionable Steps: Plan and report an AIPW analysis
| Step | Research action | Quality gate |
|---|---|---|
| 1. Define the causal target | Specify the intervention, comparator, time zero, outcome, follow-up, population, estimand, and effect scale. | The treatment contrast corresponds to a clinically meaningful and reproducible intervention. |
| 2. Build the adjustment strategy | Use clinical knowledge and a causal diagram to select pre-treatment covariates for the treatment and outcome models. | No post-treatment variable is included merely because it predicts the outcome. |
| 3. Fit and inspect both models | Estimate treatment probabilities and treatment-specific outcome predictions, using prespecified flexible terms when justified. | Calibration, overlap, balance, influential observations, and functional form are assessed. |
| 4. Estimate with valid uncertainty | Compute the AIPW contrast with an appropriate variance estimator, accounting for clustering, repeated observations, or sample design where relevant. | Confidence intervals reflect the estimator and nuisance-model fitting rather than a naive regression shortcut. |
| 5. Stress-test the conclusion | Compare reasonable specifications, examine weight truncation or target-population changes, and conduct sensitivity analysis for unmeasured confounding when appropriate. | The conclusion is described as conditional on assumptions and not as proof created by double robustness. |
Cross-fitting and flexible nuisance models
Modern causal analyses may use machine learning to estimate the treatment and outcome nuisance functions. Flexible learners can reduce reliance on a single parametric form, but they introduce their own risks: overfitting, unstable predictions, poor tail behavior, and data leakage. Cross-fitting separates the observations used to train a nuisance model from those used to evaluate its predictions, which can support more reliable asymptotic behavior under suitable conditions.
Cross-fitting does not solve positivity, unmeasured confounding, or an ill-defined treatment. It also does not make every algorithm appropriate for every outcome. The analysis plan should state the candidate learners, tuning process, folds or sample-splitting scheme, performance diagnostics, and how the final causal contrast was computed. If the sample is small, the complexity of the learner should be matched to the information available.
For high-dimensional biomedical data, variable selection should be guided by the inferential objective. The causal adjustment set is not necessarily the same as the smallest set that predicts the outcome. Work on high-dimensional confounding adjustment has emphasized this distinction: a covariate that strongly predicts treatment but weakly predicts outcome can still matter for confounding control, while an instrumental variable may increase variance without solving confounding.
Evidence Summary Table
| Evidence or methods source | What it supports | Level and boundary |
|---|---|---|
| Funk, Westreich, Wiesen, Stürmer, Brookhart, and Davidian Doubly robust estimation of causal effects | Provides a clinical causal-effects treatment of combining an outcome model and a treatment model, including the double-robust rationale. | Methods foundation; the exact estimator and assumptions must match the study design. |
| Use of Machine Learning to Estimate the Per-Protocol Effect of Long-Term Treatment PubMed record | Demonstrates ensemble machine learning with AIPW for a per-protocol treatment-effect analysis. | Applied methods example; longitudinal treatment and censoring require their own models and diagnostics. |
| Antonelli, Parmigiani, and Dominici High-Dimensional Confounding Adjustment Using Continuous Spike and Slab Priors | Explains why outcome-prediction-oriented shrinkage can be inadequate for causal confounding adjustment and discusses doubly robust estimation in high-dimensional settings. | Bayesian high-dimensional methods paper; conclusions depend on model structure and data conditions. |
| Doubly Robust Estimation of Optimal Treatment Regimes for Survival Data Open-access methods article | Illustrates how doubly robust ideas extend to treatment-regime and survival settings. | Longitudinal and survival extensions require specialized estimands, data structures, and variance procedures. |
| Doubly Robust Estimation of Causal Effects Circulation: Cardiovascular Quality and Outcomes | Provides a clinical-methods explanation of combining propensity and outcome models to obtain two opportunities for a valid causal estimate under the relevant assumptions. | Clinical methods explanation; double robustness does not remove unmeasured-confounding or positivity requirements. |

Researcher's Toolkit: Audit a Doubly Robust Analysis
Use Lingcore SCI tools to organize the evidence and reporting logic around an AIPW study:
- Paper Analyzer: Extract the estimand, treatment definition, covariate timing, propensity-model specification, outcome-model specification, overlap diagnostics, and uncertainty method from a paper.
- Review Builder: Build a citation-linked comparison of outcome regression, IPW, AIPW, TMLE, marginal structural models, and longitudinal g-computation.
- Journal Matcher: Compare journals publishing causal inference, pharmacoepidemiology, outcomes research, biostatistics, and real-world evidence.
These tools support evidence organization and manuscript quality control. Researchers remain responsible for the causal estimand, identification assumptions, data provenance, diagnostics, sensitivity analyses, and clinical interpretation.
What reviewers usually ask
Reviewers commonly ask why the selected covariates were sufficient for confounding control, whether any variables were measured after treatment, and whether the treatment definition represents a realistic clinical intervention. They may also ask for propensity-score overlap plots, standardized mean differences before and after weighting, the distribution of weights, the number of observations affected by truncation, and the effective sample size.
They may question whether the outcome model and treatment model were tuned using the same data without cross-fitting, whether the variance estimator accounts for nuisance estimation, and whether the reported effect measure matches the clinical decision. If the study uses a rare outcome, survival outcome, clustered cohort, or time-varying treatment, the reviewer may expect a design-specific estimator rather than a baseline AIPW formula applied without modification.
A transparent manuscript should state which assumptions are untestable, which diagnostics provide indirect evidence, which observations define the target population, and how alternative analyses changed the estimate. Reporting an apparently favorable result is not enough; readers need to know whether the result is stable across defensible analysis choices.
Conclusion
AIPW is valuable because it combines two views of confounding adjustment rather than relying on one nuisance model alone. Its doubly robust property can protect against one type of model misspecification under the appropriate causal assumptions, and the augmentation term can improve efficiency when both models are informative. These advantages make AIPW a strong candidate for many baseline observational analyses and a useful component of more advanced causal workflows.
The method is not a guarantee of causal validity. A credible analysis begins with a clear estimand, a defensible treatment definition, a prespecified adjustment strategy, and careful assessment of exchangeability, positivity, and consistency. It then reports both nuisance models, overlap and balance diagnostics, uncertainty procedures, sensitivity analyses, and the limits of interpretation. The phrase “doubly robust” should describe a mathematical property of the estimator, not a promise that the study is free from bias.
Medical Disclaimer
This article is for medical research and educational purposes only. It does not provide medical advice, diagnosis, treatment recommendations, or a substitute for clinical, statistical, regulatory, or institutional review. Researchers must verify the cited sources, estimand, causal assumptions, treatment definitions, model diagnostics, missing-data handling, and validation results before using AIPW or any related estimator in a study or decision.