 LINGCORE SCI
Zero-Inflated and Hurdle Models for Clinical Count Outcomes
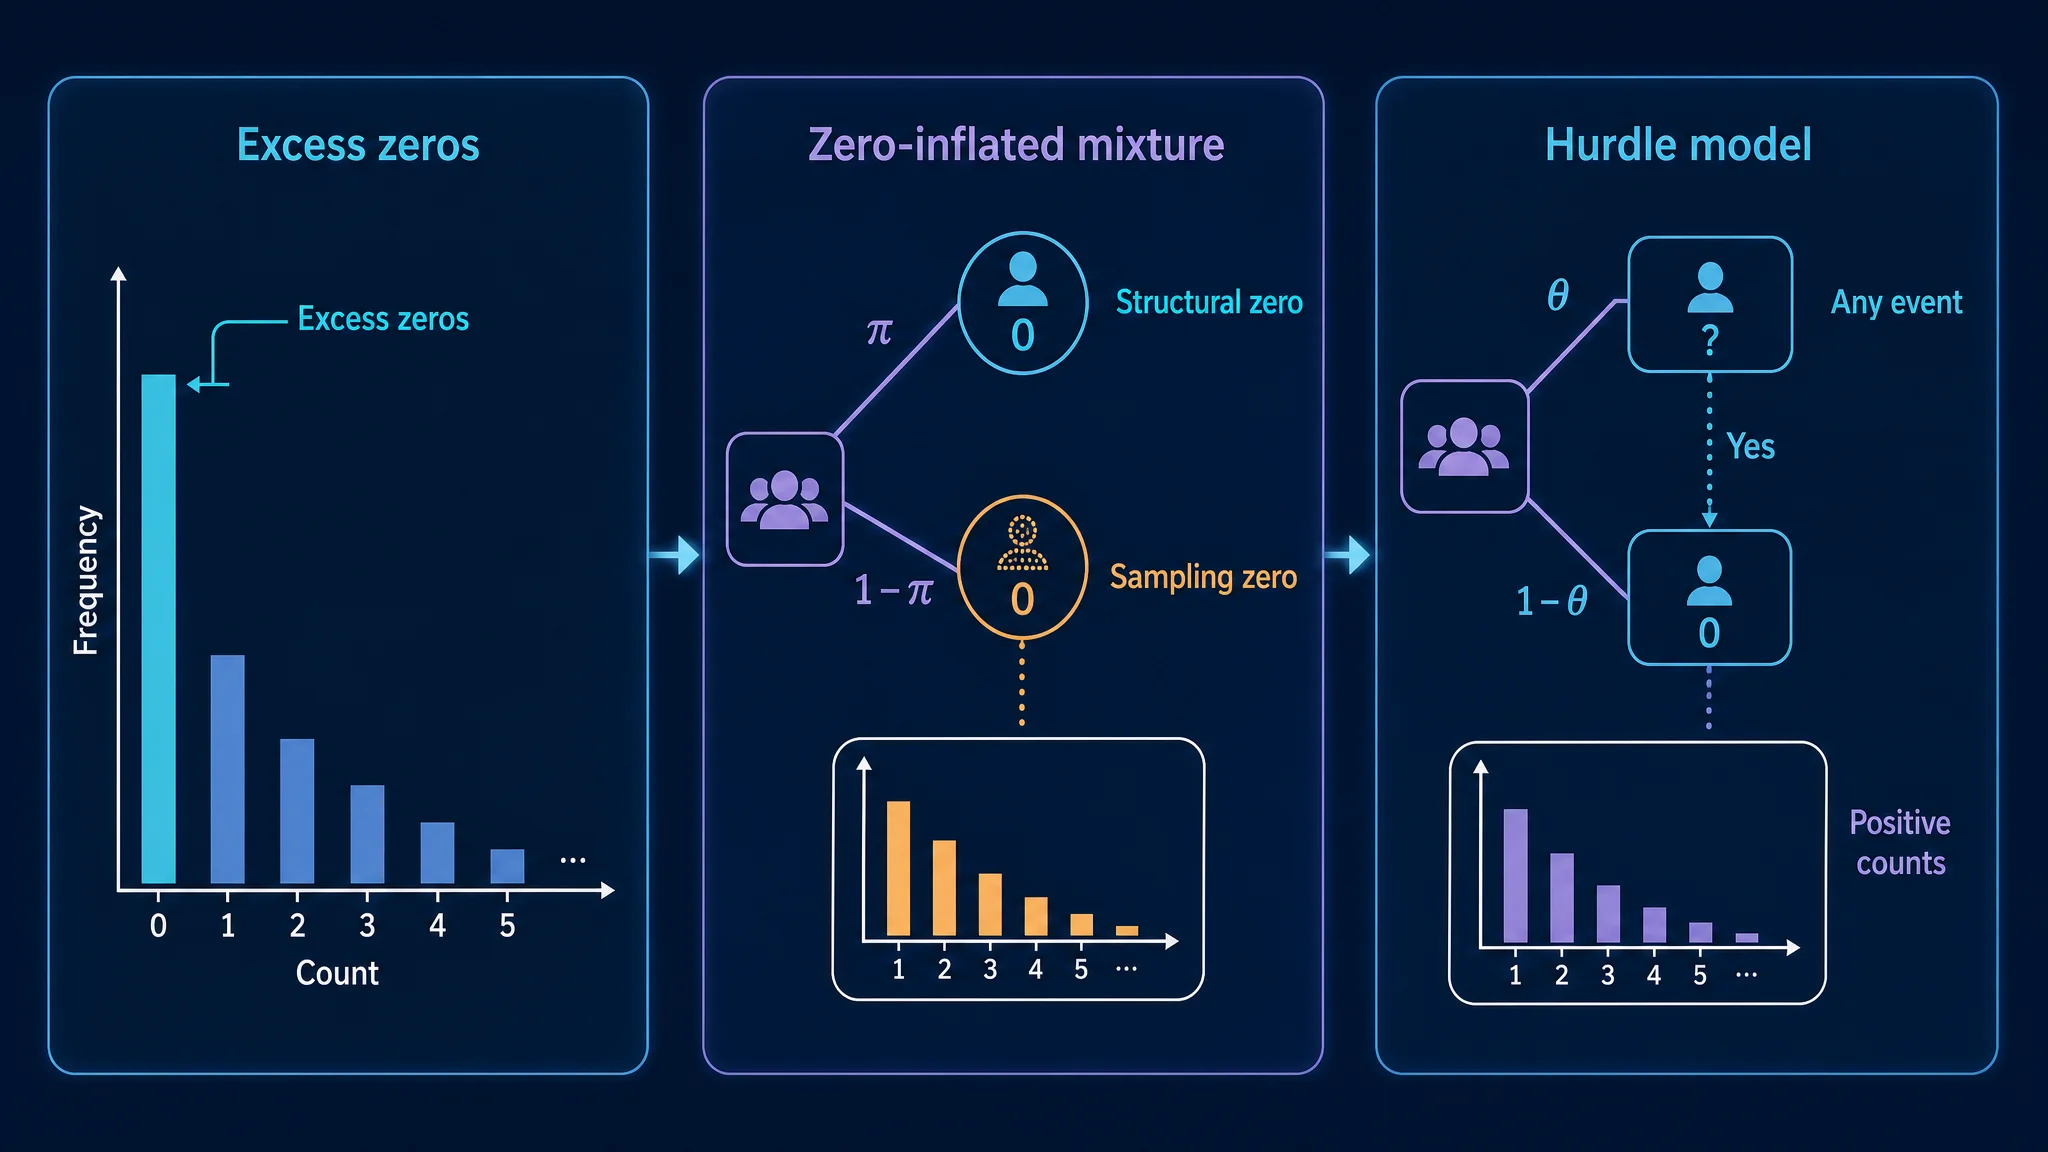
Zero-inflated models treat observed zeros as arising from a mixture of structural and count-generating processes, whereas hurdle models use one model for whether any event occurs and a separate truncated-count model for positive values. The correct choice depends on the clinical data-generating process, not on the percentage of zeros alone.
Clinical studies frequently record outcomes as counts: hospital visits, readmissions, symptom episodes, adverse events, rescue medication use, or healthcare contacts during a defined period. These outcomes are non-negative integers and are often right-skewed. A substantial group may have a count of zero, while a smaller group has a long right tail. That combination can make ordinary linear regression a poor description of the outcome distribution.
Poisson regression is a natural starting point for counts, but it assumes that the conditional mean and variance are equal. Negative binomial regression relaxes that equality and can accommodate overdispersion. When zeros occur more often than the selected count distribution predicts, analysts may consider zero-inflated or hurdle models. These models are not interchangeable. They encode different assumptions about where zeros come from and how the positive counts are generated.
Start with the clinical data-generating process
Before choosing a model, define what a zero means. A patient may have no hospital visit because the patient was not susceptible to the event during follow-up, because the event did not occur by chance, because care was received elsewhere, or because follow-up was incomplete. Those explanations are not statistically equivalent.
A structural zero is a zero that arises from a process that makes a positive count impossible or outside the relevant risk set. A sampling zero is a zero that can occur from the ordinary count-generating distribution even when a positive count is possible. These labels are conceptual assumptions, not facts that can be observed directly from the final outcome column.
For example, in a study of symptom episodes, some participants might be in a state where the symptom cannot occur under the defined measurement window, while other participants could experience the symptom but happen to report none. In a hospital-use study, however, a recorded zero may reflect no observed contact rather than true absence of need. The analyst must examine eligibility, observation time, ascertainment, access to care, and competing data sources before interpreting zero inflation clinically.
Key boundary: a large zero fraction is evidence that the ordinary model may fit poorly; it is not proof that the population contains a separate structural-zero class. A hurdle or zero-inflated model should be justified by the outcome mechanism and evaluated against plausible alternatives.
What Poisson and negative binomial models already handle
Poisson regression models the expected count as a function of predictors, usually through a log link. Its conditional variance equals its conditional mean. When the observed data show more variability than this assumption allows, standard errors and fitted probabilities may be poorly calibrated if the overdispersion is ignored.
Negative binomial regression introduces an additional dispersion parameter. It is often useful when the count distribution has a longer right tail than the Poisson distribution. Importantly, negative binomial regression can already generate zeros through its ordinary count process. A high number of zeros does not automatically require a mixture or two-part model if a negative binomial distribution describes the data adequately and the clinical question does not require a separate zero process.
Model selection should therefore proceed from the simplest clinically defensible model. Compare the observed mean, variance, zero frequency, upper tail, exposure time, repeated-measure structure, and covariate relationships. Do not use a more complex model merely because it produces a lower information criterion in one sample without checking interpretation, prediction, and stability.
Zero-inflated models: two sources of zero
A zero-inflated model combines a point mass at zero with a count distribution such as Poisson or negative binomial. The mixture component represents an additional zero-generating process, while the count component can produce both zero and positive counts. Thus, a zero-inflated model can contain two types of zero: a mixture or structural zero and a sampling zero from the count distribution.
Here, π represents the probability of belonging to the extra-zero component, while the count component describes the remaining distribution. Predictors can be included in the zero component, the count component, or both. The two parts answer different questions. A predictor associated with the zero component changes the probability of being in the extra-zero class; a predictor in the count component changes the expected count among the count-generating group.
This separation can be clinically useful when the population plausibly contains individuals who cannot experience the event under the study definition. It can also be difficult to explain when class membership is not directly observed. A coefficient from the zero component should not be described as if it were an incidence-rate ratio for the overall population. Likewise, an incidence-rate ratio from the count component is conditional on the mixture structure rather than automatically an effect on the marginal mean count.
Zero-inflated negative binomial models add an overdispersion parameter to the count component. They may be considered when the data have both extra zeros and a long, variable positive tail. Their additional flexibility increases the need for transparent diagnostics, because a complex mixture can fit the observed distribution while producing unstable or weakly identified component-specific estimates.
Hurdle models: one decision to cross, then positive counts
A hurdle model uses a two-part process. The first part models whether the outcome is zero or positive. The second part models the positive counts only, using a zero-truncated Poisson or zero-truncated negative binomial distribution. In this formulation, every zero is generated by the first part, and the positive-count model begins after the hurdle has been crossed.
The first component can be estimated with logistic regression or another binary-response model. Its result describes the probability of any event during the defined period. The second component describes the count intensity among observations with at least one event. This can be a natural representation when the clinical pathway has a clear initiation step: whether a patient is readmitted at all, whether a patient reports any episode, or whether a patient uses any rescue medication before the number of episodes is considered.
The hurdle interpretation is not that every zero is biologically structural. It is that the analyst has chosen to separate the probability of crossing from the positive-count process. That distinction can be useful even when the first process is behavioral, clinical, or operational rather than an immutable susceptibility state.
As with zero-inflated models, the two components require separate interpretation. A treatment can increase the probability of any event but reduce the number of events among those who experience at least one. Reporting only one coefficient or one p-value can conceal this pattern.
Zero-inflated versus hurdle: the central difference
| Question | Zero-inflated model | Hurdle model |
|---|---|---|
| How are zeros represented? | Zeros can arise from an extra-zero mixture and from the ordinary count distribution. | All zeros arise from the binary zero-versus-positive part. |
| What does the positive-count component include? | Zero and positive values from the count-generating component. | Positive values only, using a truncated count distribution. |
| When is the structure plausible? | When a separate class or process can produce extra zeros while the count process can still produce zeros. | When the clinical process naturally separates event initiation from the number of events after initiation. |
| How should coefficients be read? | Separately for extra-zero membership and the count process; component-specific effects are not automatically marginal effects. | Separately for any-event probability and positive-count intensity. |
| Main communication risk | Calling the latent mixture class a verified biological subgroup. | Calling the binary part a structural susceptibility mechanism when it is only a modeling decomposition. |
These models may yield different estimates because they impose different data-generating assumptions. The choice should be explained in the statistical analysis plan and linked to the clinical outcome process. A model comparison table can report fit, prediction, residual behavior, component stability, and interpretability rather than relying on a single selection statistic.
Exposure time, follow-up, and repeated observations
Counts are often observed over unequal periods. A patient followed for 12 months has more opportunity to experience a hospital visit than a patient followed for 3 months. If exposure time is part of the design, include a log exposure offset when the estimand is a rate rather than a raw count. State whether the outcome is a fixed-window count, a rate, or a recurrent-event process.
Repeated counts from the same patient are correlated. A standard zero-inflated or hurdle model that treats every row as independent may underestimate uncertainty. Mixed-effects, generalized estimating equation, cluster-robust, or other dependence-aware approaches may be appropriate depending on the target estimand and study design. The zero process may also be repeated or patient-specific, so it should not be assumed that only the positive-count component needs a random effect.
Incomplete follow-up can generate apparent zeros when an event was not observable for the full window. Distinguish a true zero from an unobserved outcome. Administrative censoring, loss to follow-up, missed visits, and differential healthcare access can affect both the zero-versus-positive process and the positive-count distribution.
Model diagnostics and comparison
Model comparison should include the observed and fitted distribution of counts, the zero frequency, the right tail, and covariate-specific predictions. A global information criterion can help compare non-identical models, but it does not establish that the latent zero mechanism is scientifically correct.
Useful checks include:
- Compare observed and predicted proportions of zero, one, two, and higher counts.
- Examine fitted mean counts and event probabilities across clinically meaningful covariate profiles.
- Assess residual behavior and overdispersion in the positive-count region.
- Check whether component-specific estimates are stable under alternative starting values or reasonable model specifications.
- Use bootstrap or resampling methods when uncertainty for derived marginal means or contrasts is not adequately represented by default output.
- Compare predicted overall means with observed means rather than interpreting only the zero component or positive-count component.
- Evaluate out-of-sample prediction when the stated goal is risk prediction rather than explanation.
For nested models, likelihood-based comparisons may be available, but the assumptions and parameter boundaries should be considered. For non-nested models, information criteria and predictive checks can be informative. A test designed for a specific comparison should not be treated as a universal decision rule.
Interpretation on the clinical scale
Component-specific log coefficients are rarely the clearest final result for clinical readers. Present predicted probability of any event, predicted positive-count mean or median where appropriate, and predicted overall mean count for representative patient profiles. If treatment groups are compared, report absolute differences and uncertainty for the two parts and for the overall outcome.
Consider a treatment that lowers the probability of any readmission but, among patients who are readmitted, is associated with more repeated admissions. A single overall rate ratio may mask the pathway. A hurdle presentation can show both stages. A zero-inflated presentation can show how the treatment relates to the extra-zero component and the count-generating component, while clearly stating that the mixture class is latent.
Do not translate a zero-inflated component into a causal claim without a causal design and assumptions. These models describe conditional outcome distributions; they do not by themselves solve confounding, informative follow-up, measurement error, or selection bias. If the study is observational, connect the count model to a prespecified confounding strategy and target estimand. The site’s guides to causal inference and quantitative bias analysis provide related context.
Five-step workflow for excess-zero clinical counts
| Step | Research action | Quality gate |
|---|---|---|
| 1. Define the count outcome | Specify the event, observation window, exposure time, ascertainment method, and meaning of a zero. | A zero is not silently conflated with missing follow-up or no opportunity for the event. |
| 2. Inspect the distribution | Compare mean, variance, zero frequency, upper tail, and patient-level repetition. | Poisson, negative binomial, zero-inflated, and hurdle candidates are considered from the observed structure. |
| 3. State the two-part assumption | Decide whether the analysis requires a latent extra-zero process or a binary any-event process followed by positive counts. | The model choice is linked to a clinical data-generating rationale, not only a fit statistic. |
| 4. Fit and diagnose | Use offsets, dependence structures, and censoring or missing-data methods appropriate to the design; compare fitted and observed distributions. | Component-specific estimates and overall predictions are stable and interpretable. |
| 5. Report marginal clinical contrasts | Present event probability, positive-count intensity, overall mean, uncertainty, and sensitivity analyses. | Readers can distinguish the two processes without mistaking them for separate observed subgroups. |
Common reporting errors
- Choosing a zero-inflated model because zeros are common: common zeros can arise from an ordinary negative binomial process or from a hurdle mechanism.
- Calling all extra zeros structural: structural membership is usually latent and must be justified, not read directly from the data.
- Ignoring exposure time: unequal observation windows can distort raw count comparisons.
- Assuming independent repeated rows: patient-level clustering and repeated observations require a dependence-aware plan.
- Reporting only one component: a treatment may affect event initiation and positive counts in different directions.
- Interpreting component coefficients as marginal effects: transform results to the overall clinical scale.
- Using fit statistics as proof of mechanism: a better fit does not establish the assumed data-generating process.
- Claiming causality from a two-part count model: outcome modeling does not replace confounding control or a causal estimand.
Evidence Summary Table
| Source | Contribution | Evidence boundary |
|---|---|---|
| Hu, Pavlicova, and Nunes, 2011 Open-access article | Explains Poisson, negative binomial, zero-inflated, and hurdle models using a clinical-trial count outcome with extra zeros. | Illustrative applied methodology; model interpretation remains dependent on the outcome process and study design. |
| Atkins and Gallop, 2007 PubMed record | Discusses zero-inflated and hurdle models for count outcomes and when they may be advantageous over standard count models. | Model suitability is conditional on the scientific question, distribution, and assumptions. |
| Loeys et al., 2012 Comparison review · PubMed record | Reviews differences in the data-generating processes of zero-inflated and hurdle models. | Conceptual distinctions should be translated to the clinical outcome rather than treated as automatic software choices. |
| Rose et al., 2022 Open-access article | Discusses zero-inflated models for epidemiologic count data with varying exposures and two-part interpretations. | Exposure adjustment and interpretation require explicit attention to the target population and observation process. |
How to write the results section
Begin by stating the count outcome, observation period, opportunity for events, and handling of unequal follow-up. Report the observed mean, variance, zero proportion, and upper-tail behavior. Explain why Poisson, negative binomial, zero-inflated, or hurdle models were considered.
If a two-part model is used, describe each component in plain language. For a zero-inflated model, state that the extra-zero class is latent and that the count component may generate both zero and positive observations. For a hurdle model, state that the first component models any event and the second models positive counts using a truncated distribution.
Present model estimates with transformed clinical contrasts. Include predicted probability of any event, expected positive count, and overall expected count when these quantities answer the clinical question. Report uncertainty and sensitivity analyses for the zero-process specification, dispersion, missing follow-up, exposure offset, and correlation structure.
A defensible report does not ask readers to infer the meaning of zero from a regression table. It makes the measurement process, opportunity for events, model structure, component interpretation, and limitations explicit.
Researcher's Toolkit
Use Lingcore SCI to audit and structure count-outcome research:
- Paper Analyzer: extract outcome definitions, exposure windows, zero-process assumptions, offsets, dependence structures, and model diagnostics from clinical papers.
- Review Builder: synthesize evidence on Poisson, negative binomial, zero-inflated, and hurdle models with source-linked methodological boundaries.
- Journal Matcher: identify journals aligned with clinical biostatistics, epidemiology, health services research, and medical outcomes modeling.
Medical Disclaimer: This article is for research and educational purposes only. It does not provide medical advice, treatment recommendations, or a substitute for protocol-specific epidemiologic or statistical review. Researchers must verify methods against the original sources, data structure, outcome definition, and clinical context before using them in a study or manuscript.