 LINGCORE SCI
Brier Score and Prediction Error Curves in Clinical Models
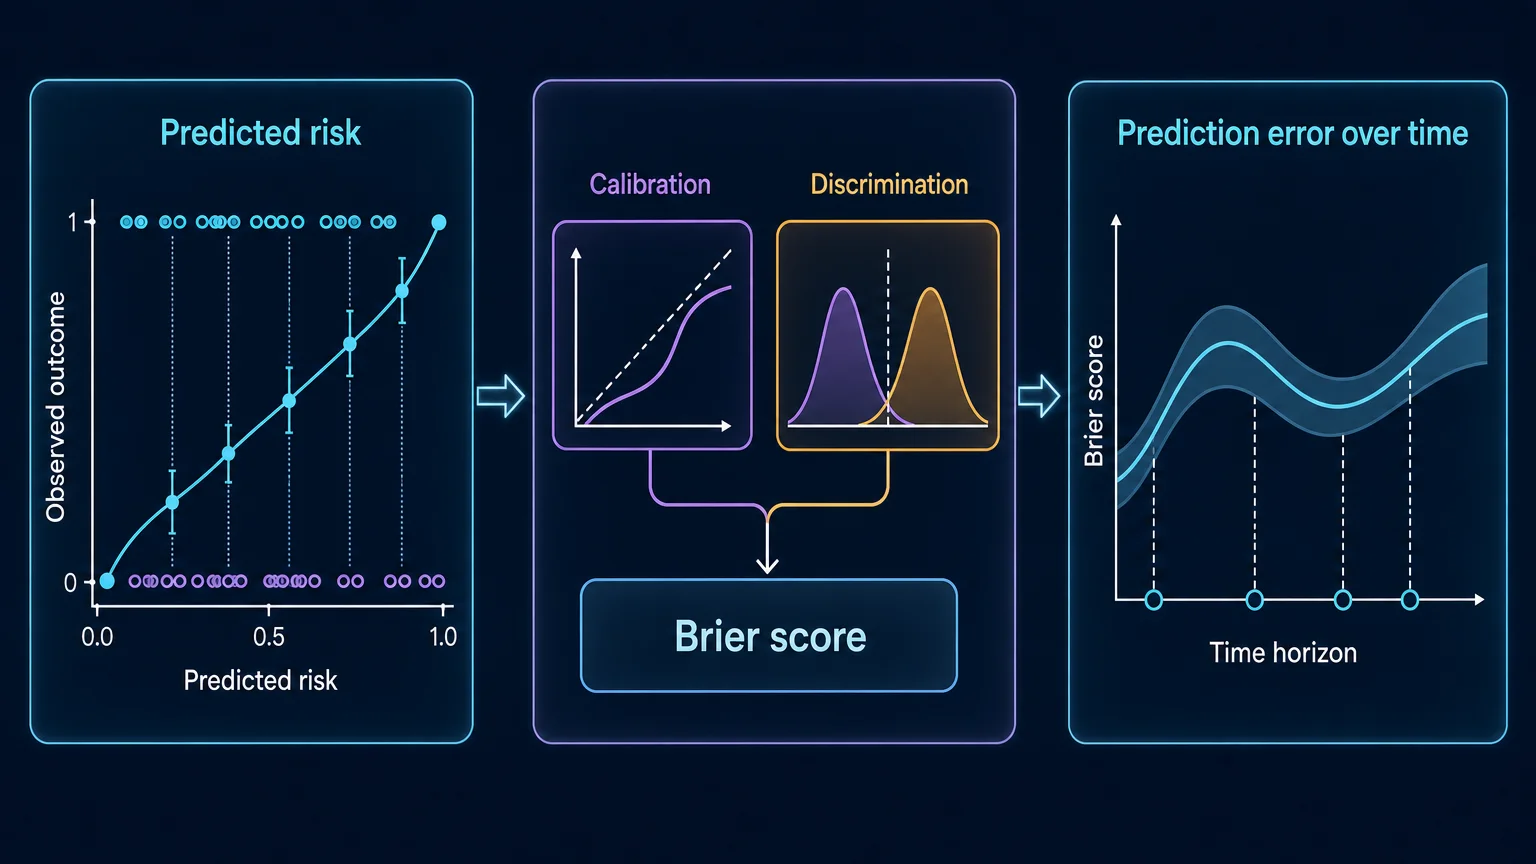
The Brier score is a proper scoring rule that summarizes the squared error of probabilistic predictions. It reflects both calibration and discrimination, so it should not be presented as a pure calibration statistic or as evidence of clinical utility. For survival outcomes, a time-dependent Brier score uses censoring-aware weighting, while a prediction-error curve shows when model performance changes across the follow-up horizon.
Clinical prediction models produce probabilities, not only rankings. A model may assign a higher risk to patients who experience an event and therefore discriminate reasonably well, yet systematically overpredict or underpredict absolute risk. Conversely, a model can be well calibrated on average while failing to separate clinically distinct risk profiles. Evaluation must therefore match the intended use: screening, prognosis, treatment selection, follow-up planning, or research stratification.
The Brier score is useful because it evaluates probabilistic accuracy on the same scale as the outcome indicator. Its usefulness is also limited because it combines several performance properties and depends on the outcome prevalence, prediction horizon, validation population, and censoring mechanism. A single Brier score cannot explain why a model performs poorly, when it fails, or whether using it improves decisions.
What the Brier score measures
For a binary outcome Y and a predicted risk p, the individual squared prediction error is the squared difference between the observed outcome and the predicted probability. Averaging this quantity across the validation population gives the binary Brier score:
A perfect probabilistic prediction has a score of zero. Larger values indicate greater squared prediction error. The score is a proper scoring rule: in expectation, a forecaster is encouraged to report probabilities that correspond to the true event risk. This property does not mean that a low score proves clinical usefulness, transportability, or causal validity.
The scale requires context. For a binary outcome, the score depends partly on event prevalence. A model that predicts the same prevalence for everyone can perform surprisingly well in an imbalanced population even though it has little discrimination. Comparisons should therefore use the same target population, outcome definition, prediction horizon, and evaluation sample. Comparing a Brier score from one cohort with a score from another cohort without accounting for prevalence and case mix can be misleading.
Why Brier score is not a calibration-only measure
Calibration asks whether predicted probabilities agree with observed risks. If a group of patients receives a predicted risk of 20%, approximately 20% should experience the event under the specified outcome definition and time horizon. Discrimination asks whether patients with higher observed risk tend to receive higher predictions than patients with lower observed risk.
The Brier score is affected by both properties. A model can have good discrimination but poor absolute calibration if predictions are consistently too high. It can have acceptable calibration-in-the-large but weak discrimination if every patient receives a similar prediction. The overall Brier score compresses these patterns into one number, which is why it should be paired with calibration plots, calibration-in-the-large, calibration slope, and a discrimination measure such as the C-statistic or time-dependent AUC when appropriate.
| Question | Metric family | What the result can support |
|---|---|---|
| Are predicted risks numerically close to observed risks? | Calibration plot, calibration-in-the-large, calibration slope, observed-to-expected summaries | Assessment of absolute-risk alignment at a defined horizon |
| Does the model rank patients by risk? | C-statistic, time-dependent AUC, concordance measures | Assessment of relative ordering, not absolute probability accuracy |
| How large is the squared probabilistic error overall? | Brier score or time-dependent Brier score | Summary of prediction accuracy combining calibration and discrimination |
| Does model use improve a clinical decision? | Decision Curve Analysis, impact evaluation, implementation study | Clinical utility under a decision threshold and care pathway |
A lower Brier score can be useful when models are evaluated on the same population and outcome definition. It is not a substitute for examining the calibration curve. It also should not be used to claim that one model is clinically preferable without specifying the action, threshold, harms, benefits, and implementation context.
From binary outcomes to time-to-event predictions
Survival models usually predict a probability at a time horizon. For a patient i and horizon t, the model may provide a predicted survival probability or a predicted event risk. The time-dependent Brier score evaluates the discrepancy between that prediction and the patient’s event status by time t.
Censoring creates a problem: for a patient censored before t, the event status at t is not fully observed. Treating that patient as event-free would be incorrect. Treating the patient as an event would also be incorrect. Time-dependent Brier-score estimators therefore use inverse probability of censoring weighting or related censoring-aware approaches to construct an estimate from the observed data.
Conceptually, the estimator gives more influence to observations whose event status at the horizon is observed and weights them according to the estimated probability of remaining uncensored. The exact estimator depends on the target quantity, censoring assumptions, competing-event structure, and whether censoring weights are estimated marginally or conditional on covariates.
Interpretation boundary: censoring weights do not make censoring non-informative by magic. The validity of a time-dependent Brier score depends on the assumptions and model used for the censoring distribution, adequate follow-up support, and a validation design that matches the prediction question.
Prediction-error curves show where performance changes
A prediction-error curve plots the time-dependent Brier score over a sequence of follow-up horizons. The curve can show early performance, late degradation, periods with sparse information, and differences between candidate models that are hidden by a single integrated summary.
When two survival models cross, one model may have lower error early and higher error later. That pattern can matter clinically: a model used to support discharge decisions may need strong short-term prediction, whereas a survivorship model may be judged over a longer horizon. An integrated Brier score summarizes performance over a prespecified time interval, but it can conceal these local differences.
The time range should be chosen from the clinical question and data support. Do not extend a curve into a period with very few individuals at risk, unstable censoring estimates, or no plausible use case merely to make the plot look complete. Report the evaluation interval, number of events, censoring pattern, and any truncation of the time horizon.
Integrated Brier score and model comparison
The integrated Brier score is an average or weighted integral of the time-dependent Brier score over a specified interval. It can be useful for comparing overall prediction error across a clinically meaningful period. The integration rule, time interval, weighting, and treatment of censoring should be prespecified.
An integrated number should always be accompanied by the underlying prediction-error curve. Otherwise, the reader cannot determine whether the difference is driven by a brief early period, a long late period, or a region with sparse information. Confidence intervals or bootstrap intervals should also be considered, especially when models are compared directly.
For nested models, report the direction and uncertainty of the difference in prediction error rather than describing a small numerical change as automatically important. A statistically distinguishable improvement may be too small to alter risk communication or care. Conversely, a modest average improvement may matter if it occurs at the decision horizon that clinicians actually use.
Competing risks and event-specific prediction
When a competing event prevents the event of interest from occurring, the prediction target must be stated precisely. A model may predict all-cause event-free survival, the cumulative incidence of a specific event in the presence of competing events, or a cause-specific quantity under a different estimand. The observed status and censoring weights must correspond to that target.
A Brier score for one event type should not be interpreted as if competing events were ordinary censoring. Treating a competing event as independent censoring can target a different quantity and may produce an inappropriate performance assessment. The analyst should state whether the prediction is for a cumulative incidence function, a cause-specific event probability, or another clinically defined outcome.
Model comparisons should use the same event definition, competing-risk convention, horizon grid, and validation population. If a model predicts several event types, report performance for each clinically relevant target rather than allowing a favorable all-cause score to obscure poor performance for a specific outcome.
Internal validation, external validation, and optimism
Performance measured on the development sample is usually optimistic because the model has been fitted to those observations. A low development-set Brier score is therefore not evidence that the model will perform similarly in a new hospital, time period, or care pathway.
Internal validation methods such as bootstrap optimism correction or cross-validation estimate how performance may change under repeated sampling from a similar development setting. External validation evaluates locked predictions in new data. The validation dataset should be separated from model updating until the original performance has been reported. For a practical transportability workflow, see the site’s article on external validation of clinical prediction models.
For clustered data, internal-external cross-validation can display how prediction error varies across hospitals, regions, or time periods. A pooled Brier score may hide site-specific miscalibration. Report cluster-level sample sizes, events, censoring, prediction horizons, and uncertainty when the intended implementation spans multiple settings.
Five-step workflow for reporting Brier-based evaluation
| Step | Research action | Quality gate |
|---|---|---|
| 1. Define the prediction target | Specify the outcome, prediction time, horizon, event type, competing-event convention, and target population. | The Brier score corresponds to a named clinical prediction question. |
| 2. Lock the validation design | Separate development, internal validation, external validation, or temporal validation data before comparing performance. | Predictions are generated without refitting on the evaluation observations. |
| 3. Estimate censoring-aware error | Use a suitable time-dependent estimator and document the censoring-weight model, support, and assumptions. | Censored observations and competing events are not silently treated as ordinary negative outcomes. |
| 4. Display components and time | Report Brier score with calibration, discrimination, and a prediction-error curve across the prespecified horizon. | The reader can see when and why models differ. |
| 5. Interpret clinical relevance | Relate performance to decision thresholds, action timing, harms, benefits, and implementation feasibility. | No claim of clinical utility is made from Brier score alone. |
Common reporting errors
- Reporting only the C-index: ranking performance does not establish absolute-risk accuracy.
- Calling Brier score a calibration test: it is an overall prediction-error measure influenced by calibration and discrimination.
- Using a naive binary score after censoring: unknown event status at the horizon requires an appropriate censoring-aware estimator.
- Ignoring the null model: a score should be compared with a relevant baseline prediction strategy when model value is being assessed.
- Integrating over an arbitrary period: an integrated score is only interpretable with its time interval and weighting rule.
- Comparing scores across different populations: event prevalence, case mix, follow-up, and censoring can change the score.
- Calling a lower error clinically useful: utility requires a decision, threshold, outcome consequence, and implementation evaluation.
- Using development performance as transportability evidence: optimism correction and external validation are separate requirements.
Evidence Summary Table
| Source | Contribution | Evidence boundary |
|---|---|---|
| Steyerberg et al., 2010 PubMed record · Open-access article | Provides a framework for discrimination, calibration, Brier score, and decision-analytic measures in prediction-model evaluation. | Methodological framework; metric choice must follow the intended prediction and decision context. |
| Gerds and Schumacher, 2006 PubMed record | Describes consistent estimation of expected Brier score in survival models with right-censored event times. | Validity depends on censoring assumptions, weighting, and the time-to-event target. |
| Graf et al., 1999 and related survival prediction-error work Prediction-error curves implementation article | Illustrates prediction-error curves and censoring-aware evaluation for survival prediction models. | Software implementation does not replace validation design, target definition, or diagnostic review. |
| Van Calster et al., 2019 Brier-score interpretation article | Clarifies that the Brier score does not evaluate clinical utility and should not be treated as a decision-analytic metric. | Clinical utility requires decision thresholds, consequences, and implementation context. |
| TRIPOD+AI, 2024 Reporting statement | Provides updated reporting guidance for prediction-model development and evaluation, including calibration and performance reporting. | Reporting completeness does not guarantee model validity or clinical benefit. |
How to write the results section
Begin by naming the population, outcome, prediction horizon, and validation design. State whether the reported predictions came from development data, resampling, a temporal split, or an external dataset. Then report the Brier score with its uncertainty interval and the corresponding calibration and discrimination summaries.
For survival outcomes, describe the censoring estimator and the time interval used for the prediction-error curve. If an integrated Brier score is reported, provide the integration limits and weighting rule. Include the curve rather than presenting only the integrated number. When models cross, describe the horizon-specific pattern instead of selecting a single period that favors one model.
Use cautious language. “The model had lower prediction error over the prespecified 1-year horizon” is different from “the model improved clinical care.” The latter requires evidence about clinician behavior, patient outcomes, and implementation. A Brier score is a model-performance result, not an impact study.
For studies that use risk predictions to guide treatment or referral, pair the performance analysis with Decision Curve Analysis when the decision threshold and action are clinically specified. For longitudinal or joint prediction settings, the site’s guide to joint models provides additional context on dynamic prediction and time-to-event outcomes.
A rigorous Brier-based evaluation makes the prediction target, validation population, censoring assumptions, time horizon, error pattern, and clinical interpretation visible. That transparency is more informative than a single favorable score.
Researcher's Toolkit
Use Lingcore SCI to audit prediction-model evidence and reporting:
- Paper Analyzer: extract prediction targets, validation design, calibration measures, censoring assumptions, and performance claims from clinical-model papers.
- Review Builder: organize evidence on Brier scores, prediction-error curves, calibration, discrimination, and clinical utility with source-linked limitations.
- Journal Matcher: identify journals aligned with clinical prediction, biostatistics, medical informatics, and prognostic modeling.
Medical Disclaimer: This article is for research and educational purposes only. It does not provide medical advice, treatment recommendations, or a substitute for protocol-specific epidemiologic or statistical review. Researchers must verify methods against the original sources, data structure, prediction target, and clinical context before using them in a study or manuscript.