 LINGCORE SCI
Bayesian Additive Regression Trees in Clinical Research
Bayesian Additive Regression Trees (BART) combine many regularized shallow trees to estimate nonlinear relationships and interactions while retaining a posterior distribution for prediction uncertainty. In clinical research, BART can support risk prediction and treatment-effect heterogeneity, but it still requires prespecified targets, leakage-safe validation, calibration assessment, and careful causal assumptions.
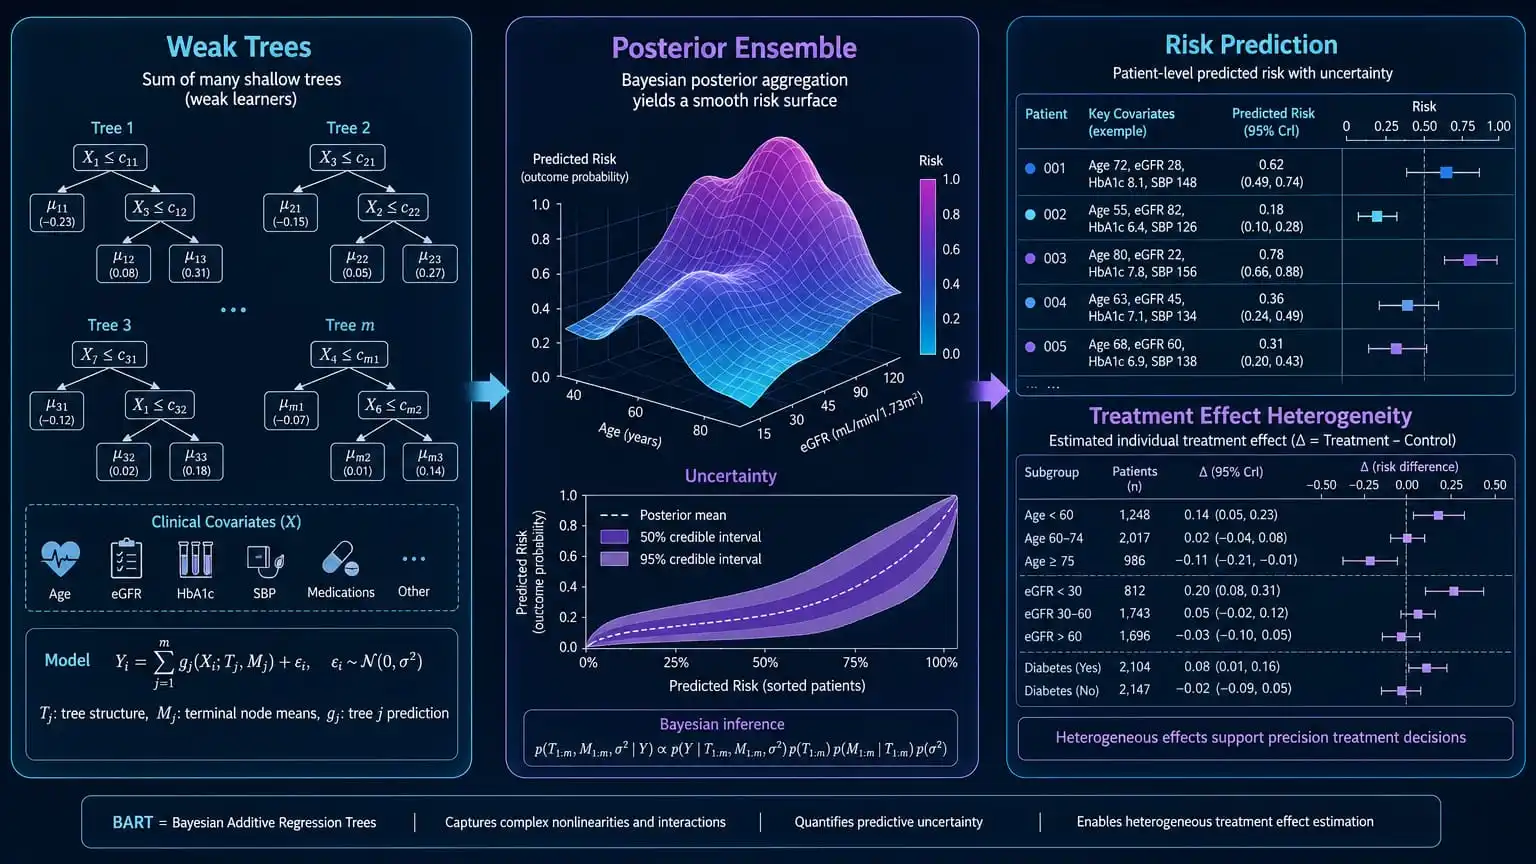
What BART estimates
BART is a Bayesian sum-of-trees model. Instead of asking one large decision tree to represent the entire relationship between predictors and an outcome, it uses many small trees. Each tree is intentionally constrained so that it acts as a weak learner. The ensemble then adds their contributions to estimate a flexible function of the covariates.
Here, Tj describes the structure of tree j, Mj contains its terminal-node parameters, and g maps a patient’s covariates to that tree’s contribution. The regularizing prior favors shallow trees and small terminal-node effects. This prevents any single tree from becoming an unstable explanatory model and spreads the signal across the ensemble.
The Bayesian component is not an ornamental label. BART produces posterior draws of the fitted function, so a prediction can be summarized by a posterior mean or median together with a credible interval. That uncertainty reflects the model and data under the specified prior and likelihood; it is not automatically a complete interval for all clinical uncertainty.
Why clinical researchers consider BART
Clinical data frequently contain threshold effects, nonlinear associations, and interactions that are difficult to specify in advance. Age may have a different association with risk in patients with severe renal impairment than in patients with preserved function. A treatment may have different estimated effects across baseline risk, disease severity, or biomarker profiles. A conventional linear model can represent these patterns only when the analyst specifies transformations and interaction terms before fitting.
BART can learn a broad class of nonlinear surfaces without requiring the analyst to enumerate every possible interaction. This makes it useful as a flexible prediction model, a benchmark for a prespecified regression model, or one component of a causal analysis. Flexibility, however, does not turn observational associations into causal effects. The estimand, treatment assignment mechanism, confounding control, positivity, and outcome definition remain central.
Prediction versus causal effect heterogeneity
| Use case | Primary target | What BART contributes | Required caution |
|---|---|---|---|
| Risk prediction | Individual or population risk under a defined outcome horizon | Flexible nonlinear prediction with posterior uncertainty | Validate calibration, discrimination, transportability, and clinical utility in new data |
| Prognostic stratification | Risk groups or continuous risk profiles | Captures interactions that may improve risk ranking | Do not convert data-driven groups into biological subtypes without independent evidence |
| Heterogeneous treatment effects | Conditional or individualized treatment-effect estimand | Can model effect modification flexibly within a causal framework | Requires exchangeability, positivity, consistency, prespecified treatment contrast, and honest validation |
| Missing-data support | Conditional outcome or imputation distribution | Can model complex relationships in an imputation or doubly robust procedure | Missingness assumptions and sensitivity analyses still determine causal credibility |
How the ensemble avoids a single unstable tree
A deep tree can fit highly specific combinations of predictors and become sensitive to small changes in the sample. BART takes a different route. The prior discourages deep, complex trees, while the sum of many weak trees allows the ensemble to approximate a complicated response surface. The individual trees are not intended to be interpreted as separate clinical pathways. Their joint posterior function is the fitted object.
This distinction matters when communicating results. A variable that appears often in tree splits is not automatically a causal determinant, and variable inclusion frequency is not a substitute for a prespecified importance analysis. If the scientific goal is explanation, report partial dependence or accumulated local effects only with appropriate caveats, and assess whether the summaries are stable across posterior draws, resamples, and clinically plausible covariate ranges.
Posterior uncertainty is part of the result
For each patient or covariate pattern, BART can provide a posterior distribution of predicted risk. The distribution may be summarized using a posterior mean and a credible interval. For treatment-effect analysis, the same logic can yield a posterior distribution for a conditional effect or a contrast averaged over a target population.
Intervals should not be presented as if they solve external validity. A narrow posterior interval can occur when a model is confidently wrong because the target population differs from the development data, because a key predictor was measured differently, or because treatment assignment created unsupported extrapolation. Report the covariate support, missingness, overlap, and validation design alongside the interval.
Clinical prediction workflow
| Step | Analysis action | Minimum reporting output |
|---|---|---|
| Step 1: Define the target | Specify population, index time, outcome, prediction horizon, and intended decision before fitting BART. | Protocol-level estimand and outcome definition |
| Step 2: Lock the data pipeline | Separate development and validation data; perform preprocessing, feature selection, and imputation without using validation outcomes. | Leakage-safe analysis diagram and missing-data plan |
| Step 3: Fit and tune transparently | Document prior settings, number of trees, burn-in, posterior draws, convergence checks, and computational seeds. | Reproducible model specification |
| Step 4: Validate performance | Assess discrimination, calibration, prediction error, subgroup performance, and uncertainty in an independent or internal-external validation design. | Performance estimates with uncertainty intervals |
| Step 5: Test clinical relevance | Compare against a prespecified benchmark and evaluate whether predictions change decisions at plausible thresholds. | Decision-analytic interpretation, not only an AUC comparison |
BART for heterogeneous treatment effects
In causal research, BART is often used to estimate flexible outcome regressions, propensity models, or treatment-effect surfaces. The method can be attractive when effect modification is likely to be nonlinear or involves interactions that are difficult to prespecify. A causal BART analysis may estimate potential outcomes under each treatment and then contrast them for a target population or covariate pattern.
The causal interpretation does not come from BART alone. Researchers must define the treatment strategies, time zero, outcome, follow-up, and estimand; identify a sufficient adjustment set; assess whether treated and untreated patients have comparable covariate support; and explain how interference, treatment adherence, missing outcomes, and competing events are handled. Posterior uncertainty quantifies uncertainty conditional on the model and assumptions. It does not measure the bias caused by an unmeasured confounder.
For subgroup discovery, avoid reporting every apparent interaction. A data-driven subgroup with a favorable posterior treatment effect can be a hypothesis for validation rather than a ready-to-use treatment rule. Report subgroup size, covariate support, multiplicity or selection procedures, calibration of the estimated effects, and performance in held-out patients.
Validation and comparison
BART should be compared with clinically credible alternatives, not only with weak baselines. Depending on the outcome, benchmarks may include a prespecified logistic or Cox model, penalized regression, generalized additive model, random forest, gradient boosting, or another model already used in the field. The comparison should use the same outcome definition, prediction horizon, missing-data strategy, and validation splits.
For binary outcomes, report calibration-in-the-large, calibration slope or flexible calibration plots, discrimination, and a proper scoring rule such as the Brier score. For survival outcomes, use time-dependent calibration and prediction-error measures that account for censoring. For treatment-effect models, evaluate both effect-estimation accuracy in simulation or known-effect settings and clinical performance of any treatment rule. A higher ranking metric alone does not establish clinical usefulness.
Common reporting errors
- Calling BART explainable because it uses trees: the fitted ensemble is not a single decision tree or a set of independent clinical rules.
- Using posterior intervals as causal guarantees: posterior uncertainty is conditional on the likelihood, prior, data, and causal assumptions.
- Tuning before the validation split: feature processing, hyperparameter selection, and outcome-informed transformations can leak information.
- Reporting variable importance as mechanism: predictive contribution does not establish biological or causal importance.
- Ignoring support: individualized effects are especially fragile where one treatment group has little comparable information.
- Comparing only AUC: calibration, absolute risk error, uncertainty, decision consequences, and transportability also matter.
Evidence Summary Table
| Source | Evidence type | Methodological contribution | Use in clinical reporting |
|---|---|---|---|
| Tan and Roy, Statistical Medicine | Methods tutorial | Explains BART, regularized tree ensembles, Bayesian computation, and General BART extensions. | Use to define the model and distinguish ensemble flexibility from a single interpretable tree. |
| Nonparametric machine learning for precision medicine | Methods perspective | Places BART within precision-medicine and treatment-effect estimation workflows. | Use when describing effect heterogeneity, individualized decisions, and assumptions. |
| BART for childhood obesity prediction | Applied prediction study | Illustrates BART as a clinical prediction approach evaluated against other machine-learning methods. | Use as an example of application, not as proof that BART is universally superior. |
| Bayesian Additive Regression Trees using Bayesian Model Averaging | Methods development | Addresses Bayesian model averaging and variable-selection-related extensions. | Use when explaining that model uncertainty and predictive performance require explicit handling. |
| BART for group testing data | Methods application | Demonstrates extension of BART to specialized data structures. | Use to show that extensions require outcome-specific likelihoods and validation. |
Researcher’s Toolkit
Strengthen your BART and clinical prediction workflow
BART analyses require careful target definition, leakage-safe validation, causal assumption review, and manuscript-ready interpretation. Lingcore SCI tools support the full research workflow:
- Paper Analyzer: Audit a BART or machine-learning paper for outcome definition, validation, calibration, uncertainty, and claim–evidence alignment.
- Review Builder: Build an evidence-based review of BART, precision medicine, heterogeneous treatment effects, and clinical prediction with verified citations.
- Journal Matcher: Identify journals suited to clinical prediction, biostatistics, causal inference, and precision-medicine manuscripts.
Conclusion
BART is a flexible Bayesian ensemble for nonlinear prediction and complex effect surfaces. Its value in clinical research depends less on the novelty of using trees than on whether the analysis defines a credible target, protects validation data, quantifies uncertainty, checks calibration and support, and reports causal assumptions explicitly. Treat BART as a statistical tool within a research design, not as a replacement for that design. When the model improves prediction or clarifies clinically plausible treatment-effect heterogeneity in independent data, it can add useful information without overstating what the data can identify.
© 2026 Lingcore Health SCI. Not affiliated with any medical institution. For research purposes only. This article is methodological information, not clinical advice or a treatment recommendation.